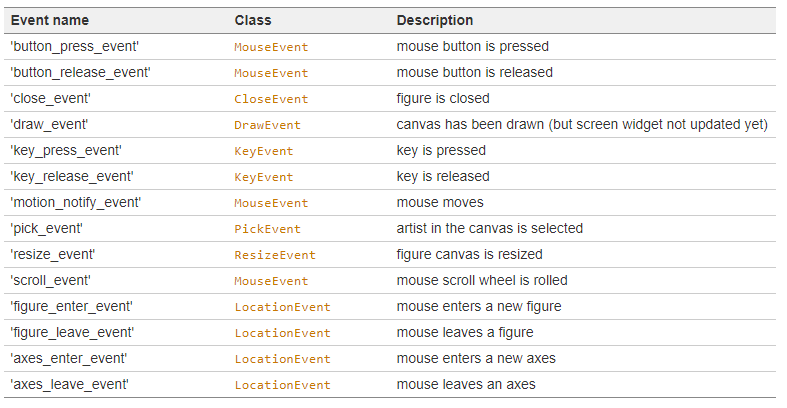
matplotbli으로 graph를 그리고 난 뒤 마우스 클릭이나 키보드 동작같은 event에 따라 다른 동작을 시킬 때(bind) 유용한 기능이다.
아래 예제 코드를 통해 사용법을 알아 보자. 아래 코드 예제는 참조 링크에서 가져왔다.
from matplotlib import pyplot as plt

class LineBuilder:
    def __init__(self, line):
        self.line = line
        self.xs = list(line.get_xdata())
        self.ys = list(line.get_ydata())
        self.cid = line.figure.canvas.mpl_connect('button_press_event', self)

    def __call__(self, event):
        print('click', event)
        if event.inaxes!=self.line.axes: return
        self.xs.append(event.xdata)
        self.ys.append(event.ydata)
        self.line.set_data(self.xs, self.ys)
        self.line.figure.canvas.draw()

fig = plt.figure()
ax = fig.add_subplot(111)
ax.set_title('click to build line segments')
line, = ax.plot([0], [0])  # empty line
linebuilder = LineBuilder(line)

plt.show()
결과 >> fig에서 마우스를 클릭할때마다 라인이 연결되서 생김

click button_press_event: xy=(174, 243) xydata=(-0.03415322580645162, 0.0016071428571428625) button=1 dblclick=False inaxes=AxesSubplot(0.125,0.11;0.775x0.77)
click button_press_event: xy=(250, 310) xydata=(-0.017298387096774198, 0.02154761904761905) button=1 dblclick=False inaxes=AxesSubplot(0.125,0.11;0.775x0.77)
click button_press_event: xy=(388, 312) xydata=(0.013306451612903225, 0.02214285714285716) button=1 dblclick=False inaxes=AxesSubplot(0.125,0.11;0.775x0.77)
click button_press_event: xy=(409, 188) xydata=(0.01796370967741935, -0.01476190476190476) button=1 dblclick=False inaxes=AxesSubplot(0.125,0.11;0.775x0.77)
해석>>
fig = plt.figure()
ax = fig.add_subplot(111)
우선 그림그릴 fig와 axes를 위처럼 선언했다.
line, = ax.plot([0], [0])
x,y 축의 값을 0,0 중앙에 배치하고 line 에 객체 값을 넣었다. line, 을 한 것은 리스트 값을 빼온다는 뜻임. 즉,
line = ax.plot([0], [0])[0]와 같은 의미 임
self.xs = list(line.get_xdata())
self.ys = list(line.get_ydata())
line에서 x,y 값을 받아서 리스트로 넣어둠
self.cid = line.figure.canvas.mpl_connect('button_press_event', self)
마우스 버튼을 누를 경우 self 즉 LineBuilder 클래스를 호출하겠다는 의미이다.
def __call__(self, event):
LineBuilder 이 호출될때 event 값과 같이 받아서 __call__이 동작한다.
self.xs.append(event.xdata)
self.ys.append(event.ydata)
self.line.set_data(self.xs, self.ys)
self.line.figure.canvas.draw()
event 에서 x,y 값을 받아서 set_data 로 line에 추가 하고 그리면 된다.
/////////////////////////////////////////////////////////////////////////////////////
button_press_event 말고 아래 목차처럼 다양한 event가 존재한다. 테스트를 위해 event 변경해서 위 예제를 진행해보면 될 듯하다.

참조>>
'파이썬(Python) > matplotlib' 카테고리의 다른 글
| [Python]Matplotlib 그래프 그리기 팁(사이즈, subplot, 주석 (0) | 2022.03.04 |
|---|---|
| [Python, matplotlib] 선 스타일, 선 색상, 선 두께 (0) | 2021.10.17 |
| [Python, matplotlib] 여러 그래프에 한 화면에 그리기 (subplot) (0) | 2021.10.16 |
| [Python, matplotlib] 그래프에 Grid 그리기 예제 (옵션사용) (0) | 2021.10.15 |
| multiple plot in one figure (여러 plot 한 화면에 표기) (0) | 2020.11.18 |