목차

파이썬 sklearn train_test_split 란?
Sklearn train_test_split 함수는 데이터(Dataset)를 트레이닝 데이터와 테스트 데이터로 아래와 같이 분류 해줍니다.
- Training data
- Test data
머신 러닝(Machine Learning) 알고리즘은 데이터를 분석해서 Performance를 높이는 방식입니다. 머신러닝 모델을 만들었다고 가정을 하면 이 모델이 정상적인 Performance를 보이는지 확인하는 작업이 필요 합니다.

사용자가 가지고 있는 데이터를 Training 과 Test 데이터로 분리 합니다. 그리고 Training 데이터를 사용해서 머신러닝 모델을 만듭니다. 그리고 해당 모델을 Test 데이터로 검증해봅니다. 이때 Sklearn train_test_split 함수는 Performance의 결과를 0~1 사이 수치로 알려 줍니다.
이때 트레이닝 데이터와 테스트 데이터 분류 비율은 사용자가 적절히 분류하는데 일반적으로 8:2 정도의 비율로 나눕니다.
파이썬 sklearn train_test_split 구조
Python Sklearn 라이브러리의 train_test_split 함수의 구조는 아래와 같습니다.
train_test_split(X, Y, test_size=, random_state=)
X, Y는 입력 변수 값을 의미 합니다. X 값은 2차 배열(Matrix) 구조입니다. 만일 1차 배열로 되어 있다면 Numpy 의 reshape(-1,1) 함수를 사용해서 변경해줍니다.
Y 값은 1차 배열(Matrix)로 넣어주어야 합니다.
test_size 는 트레이닝과 테스트 데이터의 비율을 결정 합니다. 아래 예제를 통해 쉽게 이해해보겠습니다.
random_state 에 값을 입력하지 않으면 랜덤한 선택으로 데이터 값을 분류 합니다. random_state를 특정 수로 결정하면 Seed 값이 동일해서 동일한 방식으로 데이터를 분류 해줍니다.
파이썬 sklearn train_test_split 실습 예제
전체 코드>>
from sklearn.linear_model import LinearRegression
from sklearn.model_selection import train_test_split
import matplotlib.pyplot as plt
import pandas as pd
from numpy import random

data_set = []
y_list = []
for _ in range(50):
    x_val = random.randint(1,10)
    mul = random.uniform(0.7,1.2)
    y_val = x_val*mul

    data_set.append([x_val, y_val])

df=pd.DataFrame(data_set, columns=['x_value','y_value'])
print(df)

x = df.iloc[:, :-1].values
y = df.iloc[:, -1].values

x_train, x_test, y_train, y_test = train_test_split(x, y, test_size=0.2, random_state=1)

L_reg = LinearRegression()
L_reg.fit(x, y)
y_pre = L_reg.predict(x)

print("기울기: ", L_reg.coef_)
print("절편: ", L_reg.intercept_)
print("x_train 개수: ", len(x_train))
print("y_train 개수: ", len(y_train))
print("x_test 개수: ", len(x_test))
print("y_test 개수: ", len(y_test))
print("Performance 점수: ", L_reg.score(x_train, y_train))

#그래프 그리기
plt.title('Regression')
plt.xlabel('x value')
plt.ylabel('y value')
plt.scatter(x, y)
plt.plot(x, y_pre, color='red')
plt.show()
결과>>
    x_value   y_value
0         7  7.150910
1         6  4.750644
2         8  7.580228
3         3  3.495249
4         2  1.428341
5         2  1.455419
6         2  1.561139
7         3  3.342473
8         3  3.059255
9         8  8.484173
10        1  0.985496
11        6  5.685804
12        8  7.486872
13        8  7.706517
14        2  1.535876
15        3  3.398264
16        9  7.746179
17        5  3.828287
18        8  9.152750
19        4  4.032381
20        3  2.986556
21        5  4.992626
22        6  7.020289
23        1  0.704519
24        4  4.642882
25        8  6.917977
26        3  2.538919
27        6  5.512227
28        4  4.484763
29        7  7.349609
30        4  3.600716
31        2  1.903808
32        9  8.292854
33        2  1.516925
34        3  3.425321
35        5  4.774040
36        8  7.837990
37        7  7.338778
38        8  7.509871
39        9  6.432199
40        8  9.356996
41        7  8.161446
42        2  1.557638
43        5  4.121262
44        1  1.032610
45        5  3.936940
46        3  3.430565
47        6  4.562347
48        3  2.618386
49        8  5.653631
기울기:  [0.94632287]
절편:  0.030004629849251785
x_train 개수:  40
y_train 개수:  40
x_test 개수:  10
y_test 개수:  10
Performance 점수:  0.8985128068517012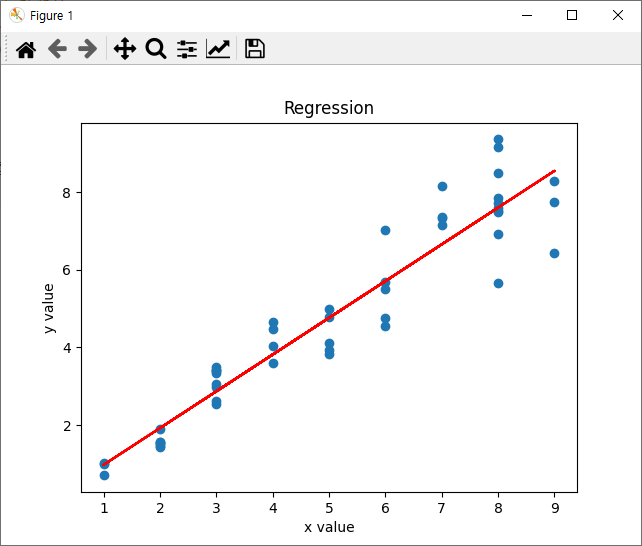
주석>>
data_set = []
y_list = []
for _ in range(50):
    x_val = random.randint(1,10)
    mul = random.uniform(0.7,1.2)
    y_val = x_val*mul

    data_set.append([x_val, y_val])

df=pd.DataFrame(data_set, columns=['x_value','y_value'])
print(df)
Data set를 랜덤으로 생성해줍니다.
x = df.iloc[:, :-1].values
y = df.iloc[:, -1].values
x값은 2차 행렬로 y값은 1차 행열로 가져 옵니다.
x_train, x_test, y_train, y_test = train_test_split(x, y, test_size=0.2, random_state=1)데이터 셋을 train과 test로 분류 해줍니다. 이때 비율은 8:2로 설정하고 random_state는 1로 설정해서 동일한 데이터로 다음에도 1로 설정하면 동일하게 분류 해줍니다.
L_reg = LinearRegression()
L_reg.fit(x, y)
y_pre = L_reg.predict(x)
선형회기(Linear regression) 알고리즘을 사용해서 선형회기 모델을 만들어 줍니다.
plt.title('Regression')
plt.xlabel('x value')
plt.ylabel('y value')
plt.scatter(x, y)
plt.plot(x, y_pre, color='red')
plt.show()
결과를 matplotlib 라이브러리로 그래프를 만들어 줍니다.
파이썬 sklearn train_test_split 코드 다운로드
'파이썬(Python) > 머신러닝(Machine Learning)' 카테고리의 다른 글
| [Python] sklearn 정규 분포 만들기(StandardScaler), 그래프 비교 (0) | 2023.02.16 |
|---|---|
| [Python] sklearn 파이프라인(Pipeline) + ColumnTransformers (0) | 2023.02.14 |
| [Python] sklearn ColumnTransformer이란? 예제 실습(SimpleImputer, fit_transform) (0) | 2023.02.07 |
| [Python] sklearn 경사하강법(Gradient Descent)란? 사용방법 및 예제 실습(SGD) (2) | 2023.01.09 |
| [Python] sklearn 설치 및 기본 회귀 모델 예제 실습(Linear Regression) (0) | 2022.12.31 |